


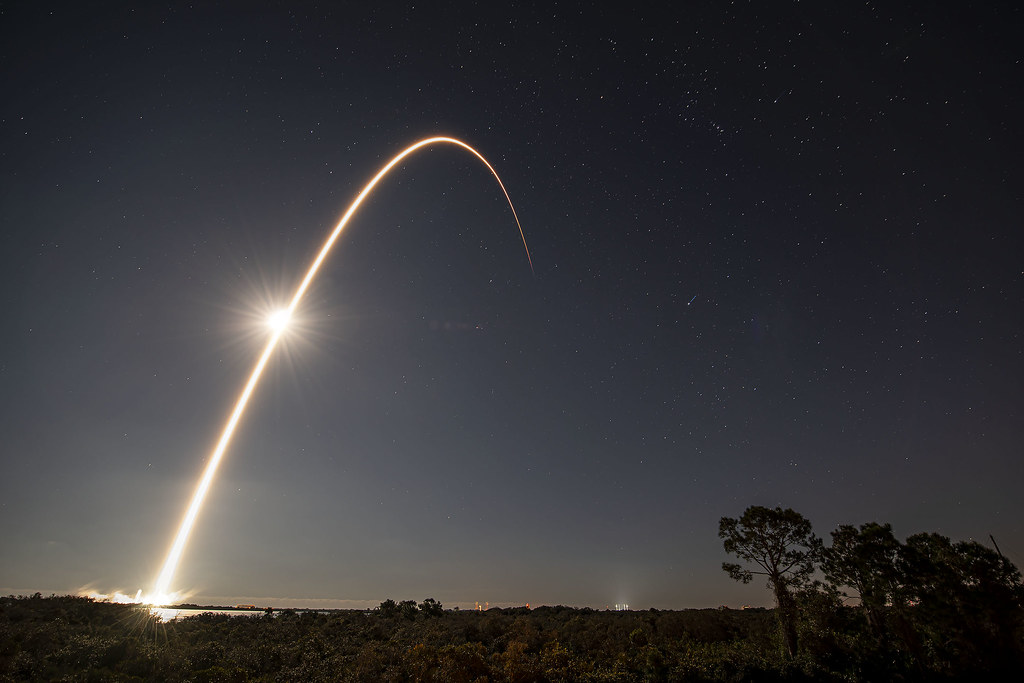
Back in February, SpaceX launched 49 Starlink satellites in the usual cluster. At the same time, two minor space weather events hit the Earth and caused 38 of those satellites to deorbit. The event was estimated to cost SpaceX tens of millions of dollars and taught us something new about the interaction of space weather and our atmosphere as reported in a scientific paper.
What is Low Earth Orbit?
To understand what happened, you’ll need to know a little about Earth’s atmosphere and Low Earth Orbits (LEO). Here are some important altitudes above sea level:
- 80 km – The thermosphere starts at 80km above the surface and extends to 600km.
- The gasses are thin enough that they layer by molecular weight.
- Auroras commonly form at 80-120km near the poles when solar wind excites the thin gases, showing space weather easily reaches the 210km parking orbit.
- NASA and the US Military consider anyone who reaches 50 miles (80 km) an astronaut.
- 100 km – The edge of space, called the Kármán line is 60 miles or 100 km above the Earth’s surface, where the atmosphere is too thin for aircraft, but still too thick for a satellite to orbit.
- 210 km – SpaceX launches their Starlink satellites to 210 km or 130 miles for a few days of testing before launching them to their permanent orbit of 500 km
- 400 km – The International Space Station (ISS) orbits at an altitude of 248 miles, or 400 kilometers, but thanks to its huge size, it needs regular fuel supplies to counter atmospheric drag.
- 450 km – The US government considers 450 km (280 mile) orbits to be Very Low Earth Orbit (VLEO) and satellites require novel technologies to combat orbital decay due to atmospheric drag.
- 2,000 km – 2,000 km (1,200 miles) is the border between LEO and Medium Earth Orbit.

Solar Wind and Solar Storms
The second part of the background information is on the sun, solar wind, and how it affects Earth:
- The sun is a fusion engine at its core, fusing hydrogen into helium and radiating energy from its surface throughout the solar system.
- The solar wind can affect Eart and our society:
- The Sun is also a strong spinning magnetic field, which sometimes bunches up to create explosions called solar flares which are often accompanied by a Coronal Mass Ejection (CME). These events are classified by the energy (Flux range):
| Flare Class | Flux Range | Impact on Earth |
|---|---|---|
| A1-A10 | Under 10-7 W/M2 | Just above background level |
| B1-B10 | 10-7 W/M2 | No noticeable impact |
| C1-C10 | 10-6 W/M2 | No noticeable impact |
| M1-M10 | 10-5 W/M2 | Brief radio blackouts Astronauts potentially endangered Auroral activity increases |
| X1 and higher | 10-4 W/M2 and above | Large radio blackouts Astronauts get sick without shelter Potential to damage satellites, power systems, communications, computers system, and much, much more. |

- Coronal Mass Ejections (CMEs) launch a billion tons of mater at several million miles per hour. If these hit the Earth, a magnetic storm happens. These storms pump gigawatts of energy into Earth’s upper atmosphere.

The Research Paper
Now that you have a little background, I’ll summarize the research article and post with a number of other links if you want to explore the data behind the article.
- “Unveiling the Space Weather During the Starlink Satellites Destruction Event on 4 February 2022” by Tong Dang, Xiaolei Li, Et Al, published August 6, 2022 in the journal Space Weather
- The Starlink Incident — Revisited post on SpaceWeather.com.
Solar Activity on Jan 29, 2022
On January 29, 2022, active region 12936 generated two minor flares aimed at Earth. The first flare, a small C6.9 flare ejected a CME travelling at 420 km/sec. Twelve hours later, a class M1.1 flare ejected a CME, traveling with an estimated velocity of 777 km/sec. The C-class flare by itself would have no noticeable effect on Earth and the M-class flare would have minimal impact. Starlink would discover that the combination of the two had a much greater impact that expected.
The top 10 solar flares from sunspot region 12936
| Number | Class | Date | Start | Maximum | End | Solar Activity |
|---|---|---|---|---|---|---|
| 1 | M1.1 | 2022/01/29 | 22:45 | 23:32 | 00:24 | Link |
| 2 | C6.9 | 2022/01/29 | 12:03 | 12:14 | 12:32 | Link |

from https://www.spaceweatherlive.com/en/solar-activity/region/12936.html
SpaceX Starlink 4-7 was scheduled to launched at 1:13 pm on February 3rd to launch 49 Starlink satellites on a Falcon 9 rocket from Pad 39A in Kennedy Space Center, Florida. The target orbit for the Starlink was 210 km for a temporary testing orbit. Remember that 450 km or 280 miles is considered Very Low Earth Orbit where satellites need to provide thrust to counter the atmospheric drag.
SpaceX uses this very low altitude to test the satellites before boosting to the operational orbit of 500 km or 310 miles. Any satellites that fail the tests will quickly deorbit, even if completely disabled, avoiding the chance of being space debris in an increasingly crowded orbital space. The SpaceX Updates page discusses this in depth, but the company plans that their satellites will last only 5-6 years before the cumulative atmospheric drag brings the satellite down.
That’s a big contrast to orbits 600 km or higher where debris from satellite collisions can remain a danger to other satellites in orbit for decades. SpaceX’s chart below shows the count of known debris items from various types (such as 1243 rocket bodies). The vertical axis shows the number of items per 1 km of height. Think of kilometer-thick “eggshells” stacked one upon the next surrounding the sphere of Earth. Any orbit below 600 km is “self-cleaning” within a relatively short period of time, so any failed satellites out of the thousands SpaceX launchs will not be a problem for long.

SpaceX knew about the first CME and determined that it would not interfere with the launch. The second CME was minor and did not rate a warning as a Class-C CME. However, the interaction between the two caused an unexpected and dramatic change in the atmosphere.
The M-class CME arrived just before midnight on Feb 2nd. Although the smaller C-class flare happened earlier than the M-class CME, it was slower and arrived a bit more than a day later in the early morning hours of Feb 4. Both are shown in the gray bands in the chart below. For our purposes, note the increases and spikes that show changes in the solar wind in the chart below:

VSW = Solar wind Velocity and Proton density
Tp = Proton Temperature and Plasma Beta
1h Dst = DST index
The first storm impacted the magnetosphere and dumped the predicted amount of energy into the outer atmosphere. This energy warmed the atmosphere, slightly increasing the density in the lowest orbital regions. This extra density was predicted and was not a problem, so SpaceX launched their rocket with 49 satellites. The satellites reached the parking orbit at 210 km or 130 miles. The smaller, slower C-class flare arrived a little more than a day later, before the atmosphere had a chance to cool, enhancing the density in the lowest orbits.
SpaceX commanded the satellites into safe mode – flying edge-on (parallel to Earth’s surface) to minimize drag. Safe mode presents the thinnest possible profile in the direction of the orbit and can be used if there is a chance of a collision with debris.

Unfortunately, safe mode worked against SpaceX and the satellites had too much drag on the solar panel in either position. Unable to counteract the added drag from the storm, 38 of 49 Starlink satellites in this string fell out of orbit.
Research
After the incident hit the news, scientists wanted to know how and why this incident happened. The interaction between the atmosphere and the two CMEs gave unexpected results. The first step was to gather solar and atmospheric data, some of which you’ve already seen.
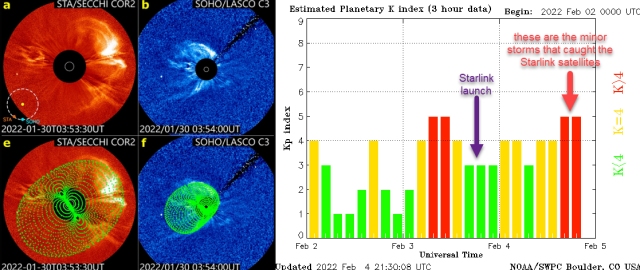
Next, the researchers looked at images of the two flares using the SOHO and STEREO A satellite images. The SOHO satellite orbits the L1 position between the Earth and the Sun, while Stereo A shares its orbit with Earth, but 35 degrees ahead of Earth.


Using the photos taken from different angles, the researchers were able to build a 3D image of the CMEs, giving more accurate data on the speed and amount of material ejected. The solar images below show the process and 3D models generated by this method. The chart shows the two flares as red bars (two bars each show the duration of the impact on Earth’s magnetosphere) sandwiching the launch:
As the graphs A-C (below) show, the density of the atmosphere increased up to 60%, though the Starlink satellites only saw a 20% increase in density. Graph F shows atmospheric drag vs. surface area. A 1m2 surface areas has almost 1/2 the drag of a 2m2 surface area, so turning the satellites out of the safe mode (streamlined) increased the surface area and the atmospheric density overwhelmed the weak ion engines the satellites used.

D: Atmospheric Density observed by Swarm-C and modeled by TIEGCM
E: Change in atmospheric density from Feb 3-5 at four altitudes.
F: Estimated satellite decay by area – A = 1m2, B=2m2, C=25m2 –
The solid lines show the increased orbital decay with the storm.
Results and Conclusion
The combination of the low orbit, weak engines, and two CMEs increasing atmospheric drag doomed the 38 satellites and they would stay in orbit just one day before starting to deorbit. By Feb 8, 2022, the last of the 38 doomed satellites came down near the California coast.

SpaceX has changed its launch procedure to use 320 km instead of 210 km for the testing orbit. However, even that height is below the 450 km VLEO orbit that requires thruster for station keeping. One of the co-authors, Jiuhou Lie, warns that during a severe geomagnetic storm, air density could increase 200% to 500% at that altitude. The good news is that even the old standard would have caused a launch delay during such a storm.
Space scientists have changed the way they warn about CMEs impacting Earth’s environment to now note if smaller CMEs arrive in quick succession. The improved modeling of CME physical structure will also improve predictions of storm severity and speeds. The paper’s authors call for closer communication between space monitoring and all launch authorities so the launch authorities can make better decisions on launching or launch delays. Hopefully, better monitoring and modelling will prevent future accidents for SpaceX and all other launches.
References
If you’re interested in reading further, I invite you down the rabbit hole. 😉 This has been a fun little research project as I dug deeper into the events, I learned more about the space weather, which has always been a fascination for me. I hope you take a look at the research paper or article for more information:
Research Paper: https://agupubs.onlinelibrary.wiley.com/doi/10.1029/2022SW003152
SpaceWeather.com Article: https://spaceweatherarchive.com/2022/09/13/the-starlink-incident-revisited/
SpaceWeather.com: https://spaceweather.com/
Information Sources:
Space Weather Prediction Center: https://www.swpc.noaa.gov/
SpaceWeatherLive.com Region 12936 Data: https://www.spaceweatherlive.com/en/solar-activity/region/12936.html
NASA’s Sun-Earth page: https://www.nasa.gov/mission_pages/sunearth/index.html
The Sun-Earth Connection (Educators): https://science.nasa.gov/sun-earth-connection
Earth’s Magnetosphere: https://www.nasa.gov/magnetosphere
Mission Pages:
SpaceX Updates: https://www.spacex.com/updates/
SpaceX Launches: https://www.spacex.com/launches/
Starlink on Wikipedia: https://en.wikipedia.org/wiki/Starlink
SOHO Mission: https://soho.nascom.nasa.gov/home.html
STEREO Mission: https://www.nasa.gov/mission_pages/stereo/main/index.html
More Stories
6/18/26 Meeting Topic – NASA & Artemis
September 2025 Meeting Presentation
August Meeting Presentation